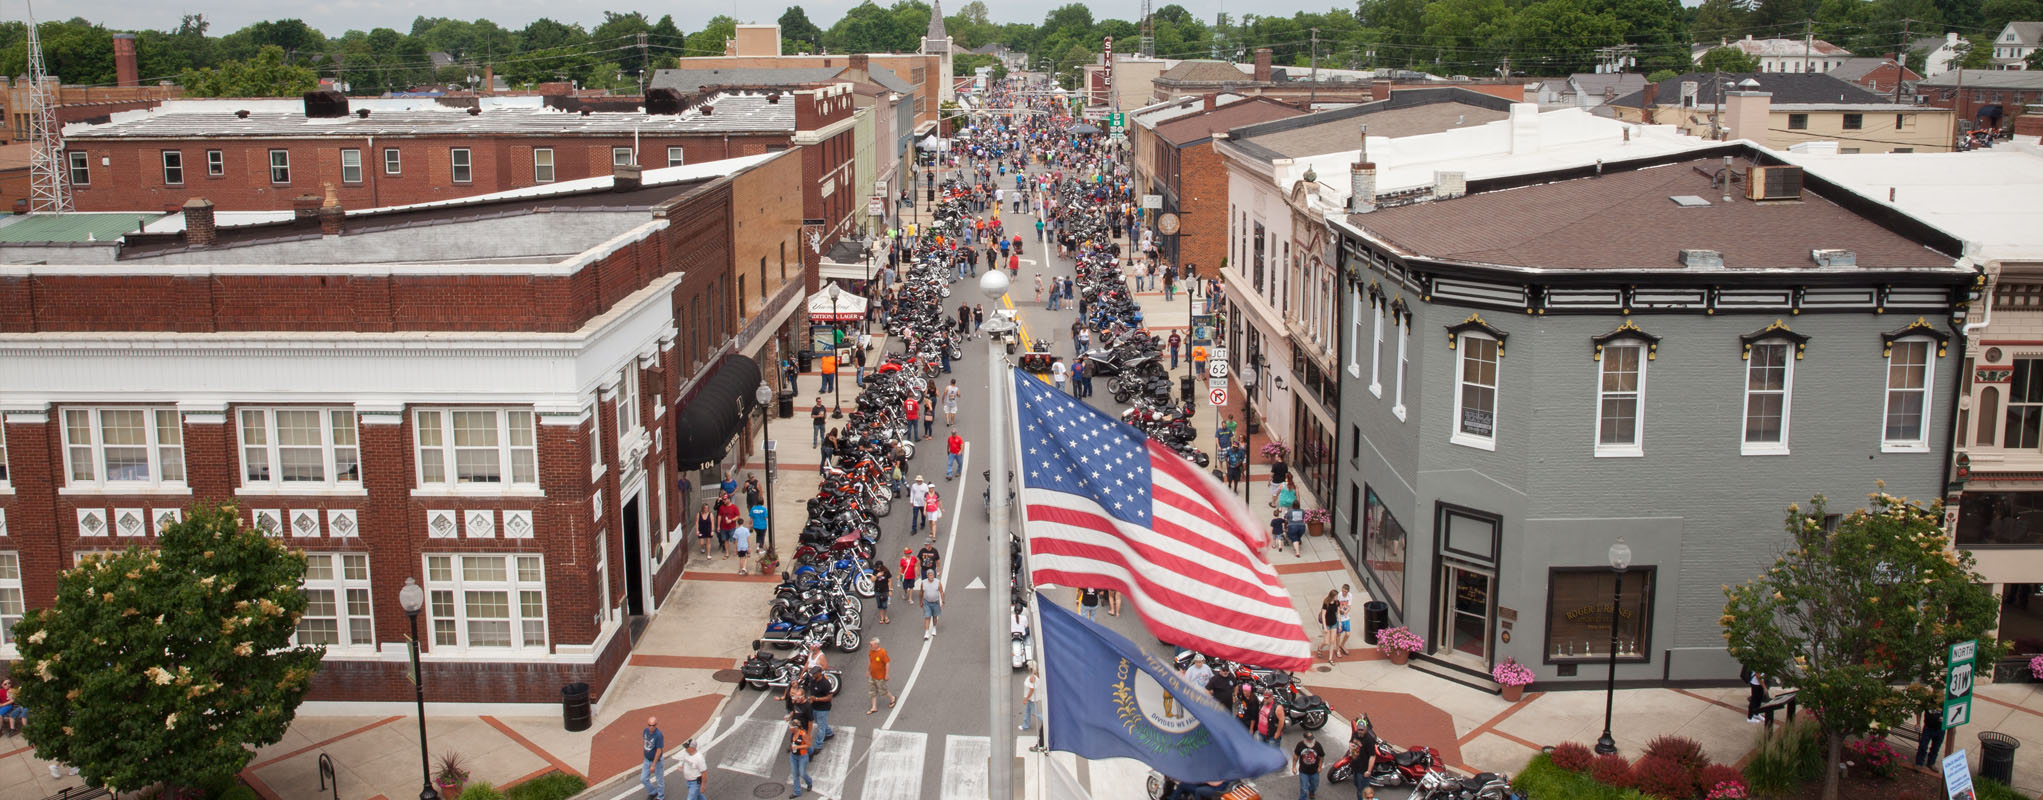
Something for everyone to enjoy
Hardin County has experienced steady economic development driven by its strategic location, diverse industries, and investment in infrastructure. The county’s economy is centered around a mix of manufacturing, agriculture, retail, and services, with key efforts aimed at fostering growth and enhancing its appeal as a business hub. A diverse industrial base, strategic location, and ongoing investments in infrastructure and workforce development. The region continues to balance its rich agricultural roots with growing sectors like manufacturing, tourism, and services. This dynamic mix of industries and the county’s proximity to larger urban centers contribute to a robust economic outlook for the future.
Hardin County by the Numbers
Hardin County Stats
Hardin County Stats
| Hardin County | 2012 | 2022 | % Change |
|---|---|---|---|
| Population | 108,280 | 111,941 | 3.4% |
| Gross Regional Product | $5,397,475,218 | $6,561,267,383 | 21.6% |
| Median Household Income | $59,863 | ||
| Per Capita Income | $32,151 | ||
| Poverty Level | 11.2% | ||
| Unemployment Rate | 3.3% | ||
| Labor Force Participation Rate | 57.0% | ||
| Average Commute Time | 22.2 | ||
| Number of Remote Workers | 2,510 | ||
| Percent of Remote Workers | 5.0% | ||
| Education: Less than 9th Grade | 3,145 | 1,434 | -54.4% |
| Education: 9-12th Grade | 5,173 | 4,241 | -18.0% |
| Education: High School Diploma | 23,306 | 22,643 | -2.8% |
| Education: Some College | 17,558 | 20,460 | 16.5% |
| Education: Associate's Degree | 6,509 | 8,821 | 35.5% |
| Education: Bachelor's Degree | 8,070 | 9,924 | 23.0% |
| Education: Graduate Degree and Higher | 5,594 | 6,906 | 23.5% |
| Homeowner Vacancy Rate | 1.0% | ||
| Median House Value | $160,600 | ||
| Median Monthly Rent | $854 | ||
| Percent Occupied Housing Units | 90.8% |
Greater Louisville Region
Greater Louisville Region
| Greater Louisville Region | 2012 | 2022 | % Change |
|---|---|---|---|
| Population | 1,434,953 | 1,517,937 | 5.8% |
| Gross Regional Product | $69,126,603,887 | $106,360,978,850 | 53.9% |
| Median Household Income | $71,033 | ||
| Per Capita Income | $34,919 | ||
| Poverty Level | 7.6% | ||
| Unemployment Rate | 3.5% | ||
| Labor Force Participation Rate | 62.4% | ||
| Average Commute Time | 27.0 | ||
| Number of Remote Workers | 59,276 | ||
| Percent of Remote Workers | 6.9% | ||
| Education: Less than 9th Grade | 41,826 | 28,187 | -32.6% |
| Education: 9-12th Grade | 84,226 | 66,209 | -21.4% |
| Education: High School Diploma | 312,017 | 315,945 | 1.3% |
| Education: Some College | 219,747 | 230,831 | 5.0% |
| Education: Associate's Degree | 71,758 | 96,301 | 34.2% |
| Education: Bachelor's Degree | 146,043 | 192,022 | 31.5% |
| Education: Graduate Degree or Higher | 93,667 | 123,660 | 32.0% |
| Homeowner Vacancy Rate | 1.3% | ||
| Median House Value | $178,593 | ||
| Median Monthly Rent | $847 | ||
| Percent Occupied Housing Units | 90.1% |
United States
United States
| United States | 2012 | 2022 | % Change |
|---|---|---|---|
| Population | 313,877,662 | 334,161,482 | 6.5% |
| Gross Regional Product | $15,912,802,819,300 | $24,767,834,615,600 | 55.6% |
| Median Household Income | $69,021 | ||
| Per Capita Income | $37,638 | ||
| Poverty Level | 8.9% | ||
| Unemployment Rate | 3.6% | ||
| Labor Force Participation Rate | 62.7% | ||
| Average Commute Time | 26.8 | ||
| Number of Remote Workers | 15,061,684 | ||
| Percent of Remote Workers | 9.7% | ||
| Education: Less than 9th Grade | 12,837,123 | 10,919,561 | -14.9% |
| Education: 9-12th Grade | 17,391,417 | 14,341,868 | -17.5% |
| Education: High School Diploma | 58,751,740 | 60,598,861 | 3.1% |
| Education: Some College | 44,359,412 | 45,588,261 | 2.8% |
| Education: Associate's Degree | 16,032,807 | 20,324,521 | 26.8% |
| Education: Bachelor's Degree | 37,281,933 | 47,929,733 | 28.6% |
| Education: Graduate Degree or Higher | 22,125,353 | 30,620,664 | 38.4% |
| Homeowner Vacancy Rate | 1.2% | ||
| Median House Value | $244,900 | ||
| Median Monthly Rent | $1,163 | ||
| Percent Occupied Housing Units | 88.8% |